- Research
- Open access
- Published:
TephraProb: a Matlab package for probabilistic hazard assessments of tephra fallout
Journal of Applied Volcanology volume 5, Article number: 10 (2016)
Abstract
TephraProb is a toolbox of Matlab functions designed to produce scenario–based probabilistic hazard assessments for ground tephra accumulation based on the Tephra2 model. The toolbox includes a series of graphical user interfaces that collect, analyze and pre–process input data, create distributions of eruption source parameters based on a wide range of probabilistic eruption scenarios, run Tephra2 using the generated input scenarios and provide results as exceedence probability maps, probabilistic isomass maps and hazard curves. We illustrate the functionality of TephraProb using the 2011 eruption of Cordón Caulle volcano (Chile) and selected eruptions of La Fossa volcano (Vulcano Island, Italy). The range of eruption styles captured by these two events highlights the potential of TephraProb as an operative tool when rapid hazard assessments are required during volcanic crises.
Introduction
Tephra is the most widespread of all volcanic hazards. Variations in deposit thickness and and grain–size, from proximal (i.e. a few kilometres from the vent) to distal locations (i.e. hundreds of kilometres) result in a wide range of potential impacts, from total loss (e.g. human and livestock casualties, destruction of vegetation and crops, collapse of buildings) to less dramatic but highly problematic consequences (e.g. damage to crops, damage to non-structural building elements, disruption of water and electricity supplies; Blong 1984; Jenkins et al. 2014; Wilson et al. 2011). Tephra is also responsible for widespread disruption of civil aviation (Biass et al. 2014; Bonadonna et al. 2012; Guffanti et al. 2009; Scaini et al. 2014). Both the dispersal and sedimentation of tephra can generate complex and multi-faceted impacts at different spatial and temporal scales, affecting physical, social, economic and systemic aspects of societies. These complex impacts require proactive strategies to effectively increase the level of preparedness and mitigate the risk to exposed communities (Birkmann 2006). In order to develop effective proactive risk mitigation strategies, it is necessary to both develop comprehensive probabilistic hazard assessments for tephra dispersal and sedimentation and communicate the outcomes to decision-makers and stakeholders.
Our method for quantifying the hazard from tephra fallout begins with the identification of eruption scenarios based on detailed stratigraphic studies. Eruption scenarios reflect the typical eruption styles at a given volcano and are characterized by ranges of eruption source parameters (ESP) such as plume height, erupted mass, mass eruption rate (MER) and total grain–size distribution (TGSD). Eruption scenarios are constrained by the completeness of the eruptive record, as well as an understanding of the range of past activity observed at analogous volcanic systems (Marzocchi et al. 2004; Ogburn et al. 2016). Highly–studied systems result in eruption scenarios describing precise eruptive episodes, whereas poorly–known systems can often only be characterized by generic eruption scenarios based on analogue systems. Some hazard studies have relied on a deterministic approach, defining ESPs as a single set of best guess values, and hazard as expected tephra accumulation (e.g. isomass maps, kg m−2; Barberi et al. 1992). Other strategies rely on a large number of simulations to explore the range of variability in ESPs and atmospheric conditions. In the latter case, the hazard is quantified as a probability to exceed a given tephra accumulation and can be expressed either as conditional to the occurrence of the eruption scenario (e.g. scenario–based hazard assessment; Biass et al. 2016; Bonadonna et al. 2005; Scaini et al. 2014; Volentik and Houghton 2015) or as absolute when the long–term probability of the eruption scenario is also quantified (Bear-Crozier et al. 2016; Jenkins et al. 2012; Marzocchi and Bebbington 2012; Sandri et al. 2014, 2016; Thompson et al. 2015).
The TephraProb package provides a framework for i) accessing, pre–processing, and analyzing model inputs (e.g. retrieval and probabilistic analysis of Reanalysis wind data), ii) building probabilistic eruption scenarios, iii) running a suitable tephra dispersal model and iv) post-processing and exporting model results. The package is written in Matlab and released under an open–source GPLv3 license on VHub and GitHub. This paper provides an in–depth review of the possibilities offered by the TephraProb package. The case studies of Cordón Caulle volcano (Chile) and La Fossa volcano (Vulcano Island, Italy) are used to illustrate the flexibility of TephraProb for working with a wide range of probabilistic eruption scenarios and eruptive styles. The user manual provides a technical description of each functionality and each individual Matlab function. The latest version of the package can be found at https://github.com/e5k/TephraProb.
Case studies
Cordón Caulle volcano
The 2011 eruption of Cordón Caulle volcano (Chile), part of the Puyehue–Cordón Caulle system, is considered as an example of a long–lasting sustained sub–Plinian eruption. Cordón Caulle started erupting on the 4th of June 2011 after a month–long seismic swarm (Bonadonna et al. 2015; Collini et al. 2013; Pistolesi et al. 2015). The initial and most vigorous phase (Unit 1; Bonadonna et al. 2015; Pistolesi et al. 2015) was characterized by plume heights varying between 10–14 km asl during a 24–30 h period with a mean MER of 107 kg s−1. The eruption continued until the 15th of June with MER ≥106 kg s−1 and was followed by long–lasting, low–intensity activity (Bonadonna et al. 2015; Pistolesi et al. 2015). Modelling details of the 2011 eruption of Cordón Caulle can be found in Elissondo et al. (2016).
La Fossa volcano
During the last 1000 years, La Fossa volcano (Vulcano Island, Italy) experienced two sub-Plinian eruptions with similar intensities and magnitudes (i.e. plume heights of 7–8 km asl and erupted masses of 2.1–2.4 ×10⁹ kg) and at least 8 long–lasting Vulcanian cycles (Di Traglia et al. 2013). Each of these Vulcanian cycles is characterized by total fallout masses of 0.1–1 ×10⁷ kg over durations of 3 weeks to 3 years. The most recent eruption of La Fossa in 1888–1890, described in detail by Mercalli and Silvestri (1891) and De Fiore (1922), was characterized by explosions occurring every 4 hours to 3 days and associated with plume heights of 1–10 km asl (Di Traglia 2011; Di Traglia et al. 2013; Mercalli and Silvestri 1891). A detailed description of the probabilistic modelling of these eruption scenarios can be found in Biass et al. (2016).
The Tephra2 model
The Tephra2 model (Bonadonna et al. 2005, 2012; Connor and Connor 2006; Volentik et al. 2009) uses an analytical solution of the advection–diffusion equation to compute the tephra mass accumulation depending on eruptive and wind conditions. Main characteristics of the model include: i) grain–size-dependent diffusion and particle density, ii) a vertically stratified wind, iii) particle diffusion within the rising plume and iv) settling velocities that include variations in the Reynolds number depending on whether particles follow a laminar or turbulent flow regime. Tephra2 requires 3 input files: i) a configuration file that specifies the dynamics of the eruption and the surrounding atmosphere, including location of the vent, plume height, erupted mass, TGSD, range of particle sizes and particle densities, and atmospheric and dispersion thresholds, ii) a table of locations where tephra accumulation is calculated, and iii) a table of wind conditions influencing the horizontal dispersion of tephra, including atmospheric level and the wind speed and wind direction at this level. Note that since Tephra2 solves the advection–diffusion equation analytically, the wind is vertically stratified but horizontally and temporally homogeneous, thus limiting the validity of our approach to a few hundred kilometers around the vent. The user is referred to Bonadonna et al. (2005); Connor and Connor (2006) and Volentik et al. (2009) for a complete description of Tephra2 and to Scollo et al. (2008a,b) and Bonadonna et al. (2012) for a comparison with other volcanic ash transport and dispersion models (VATDM).
Tephra2 simplifies atmospheric turbulence by using two different diffusion laws, one for coarse and another for fine particles (Bonadonna 2006; Bonadonna et al. 2005; Connor and Connor 2006; Volentik et al. 2009). These two diffusion regimes of fallout are based on three empirical parameters, namely the fall–time threshold (FTT) acting as a threshold for the modelling of the diffusion of small and large particles (i.e. power law vs. linear diffusion), a diffusion coefficient used for the linear diffusion law and an apparent eddy diffusivity fixed at 0.04 m 2 s−1 for the power law diffusion (Bonadonna et al. 2005; Suzuki 1983). Secondary atmospheric effects (e.g. topography effects) are neglected. The reader is referred to Bonadonna et al. (2005); Connor and Connor (2006); Volentik et al. (2009) and Volentik et al. (2010) for further information regarding the modeling parameters used by Tephra2. The version of Tephra2 used here was modified to accept an additional input file defining the TGSD, which accounts for aggregation processes (e.g. Biass et al. 2014; Bonadonna et al. 2002a). Aggregation is further discussed in Section “Total grain–size distribution”.
The probability P(x) of tephra released from an eruption plume at some vertical height above the vent is controlled by a beta probability density function (PDF):
where x is a dimensionless height normalized to the plume height and B(α,β) represents the beta function defined by two parameters, α and β, both greater than 0. Changing the values of α and β changes the shape of the PDF. When α=β=1, the beta function is identical to a uniform random function and the probability of tephra release is equal along the height of the plume. When α>β, the release pattern is shifted towards the top of the plume; when α=β≠1 tephra release is greatest from the middle of the plume; when α<β the release pattern is shifted toward the base of the plume.
The TephraProb package
The TephraProb package contains a set of Matlab functions integrated as a graphical user interface (GUI) assisting the user with every step required to produce comprehensive hazard assessments for tephra fallout. The GUI provides an interface facilitating programming and computation aspects, but more advanced users can customize the Matlab functions finding assistance from the detailed comments within the code and the user manual. Figure 1 summarizes the main functionality of the code, which consists of four main modules including i) Input Parameters: to retrieve and analyse the various inputs required by probabilistic hazard assessments, ii) Eruption Scenarios: to stochastically sample ESP and run eruption scenarios, iii) Post–processing: to process individual Tephra2 runs into probabilistic outputs and iv) Output: to visualize and export results. The following sections use the two case studies presented in Section “Case studies” to illustrate every step of the tephra fallout hazard assessments.

Summary of the workflow of the TephraProb package
Input parameters
Calculation points
Tephra2 requires an ASCII file of locations arranged in a three-column format containing Easting, Northing, and elevation. Since Tephra2 uses an analytical solution to the advection-diffusion-equation that solves the differential equation using a constant elevation boundary condition, calculations must be performed on flat surfaces and topography is neglected (Lim et al. 2008). Two options are available in TephraProb. The first option is to perform calculations on regularly spaced grids allowing for the compilation of probability maps. Although this is often the preferred option, calculations using large grids is time consuming and might not be achievable in some emergency contexts if computing power is limited. The second option is to perform calculations for user–selected points of interest, which results in a series of hazard curves that require a considerably shorter computation time.
One typical problem arising from the use of UTM coordinates is the shift in Easting coordinates when crossing UTM zones and the shift in Northing coordinates when crossing the equator. In both cases, TephraProb includes a correction to produce grids with contiguous UTM coordinates, where the resulting distortion is assumed negligible compared to the maximum distance deemed valid for the application of Tephra2.
Wind data
Wind velocity is a key input parameter in any tephra dispersal model because it controls the advection of the plume and the sedimentation of tephra. Probabilistic modelling requires access to wind datasets spanning at least one decade in order to capture the variability of wind conditions over a region. Most hazard assessments for tephra dispersal and sedimentation rely on Reanalysis datasets, which provide access to decades of atmospheric observations continuously interpolated in space and time. The two most frequently used datasets are the National Oceanic and Atmospheric Administration (NOAA) National Centers for Environmental Prediction NCEP/NCAR Reanalysis (i.e. joint project between the National Centers for Environmental Prediction and the National Center for Atmospheric Research; Kalnay et al. 1996) and the European Centre for Medium-Range Weather Forecasts (ECMWF) Era-Interim datasets (Dee et al. 2011). Both the NOAA NCEP/NCAR and the ECMWF Era-Interim datasets can be accessed via GUIs using TephraProb. The TephraProb package downloads the files in the NetCDF format and converts them into three–column ASCII files including altitude, wind direction (i.e. direction the wind blows towards) and wind velocity. Once the files are downloaded and converted, they can be used as an input to any tephra model and/or to explore the wind conditions over a region of interest. Note that Tephra2 uses a single wind profile per simulation extracted for one set of coordinates and one time. Therefore, each simulation is performed in an atmosphere that is vertically stratified but horizontally and temporally homogeneous.
Figure 2 illustrates the interface and the outputs resulting from wind analysis above Cordón Caulle volcano using the ERA–Interim dataset for the period 2001–2010. Figure 2 a shows median profiles of wind velocity and direction with height for the entire population. Figure 2 b and 2 c show the median wind direction averaged per year and per month, respectively. Such plots are useful to identify potential variability associated with El Niño/La Niña oscillations (Fig. 2 b) or seasonality (Fig. 2 c). Finally, wind roses (Fig. 2 d) show, for a fixed altitude, the probability that wind blows towards a given direction and at a given intensity.

Wind statistics produced by the TephraProb package as inferred from the ERA–Interim dataset for the 2001–2010 period above Cordón Caulle volcano. a Screenshot of the GUI shows the median wind velocity and median wind direction with height (solid black lines) including the 25th and 75th percentiles (error bars); b median wind direction per year; c median wind direction per month; d probability of the wind to blow in given directions and intensities at an altitude of 10 km asl
Eruptive history
Hazard assessments are based upon the assumption that future activity will be similar to past activity. In volcanology, this implies a necessity to develop scenarios of future eruptions based on the most complete possible study of the geological record in order to best constrain the eruptive history of a volcano. In practice, assessing the full spectrum of eruptions of a given system is impossible, due firstly to the fact that geological records are not continuously complete through time and secondly because field studies rarely provide a complete picture of the eruptive history (Kiyosugi et al. 2015). In most cases, eruption scenarios are constructed based on a few studied eruptions representing common eruptive styles and/or often relating underlying geologic processes with analogue eruptive events (Sheldrake 2014). Eruption databases such as the Global Volcanism Program of the Smithsonian Institute (GVP; Siebert et al. 2010; Simkin and Siebert 1994) or the Large Magnitude Explosive Volcanic Eruptions (LaMEVE; Crosweller et al. 2012, Ogburn et al. 2016) can prove useful in acquiring a global picture of eruptive history. TephraProb includes a module to access and explore the Holocene eruptive history as recorded in the GVP database. Note that the GVP module does not constitute a source of input in itself but serves as a support tool to identify eruption scenarios and key ESPs.
Figure 3 a illustrates the GUI of the GVP module, which retrieves eruptive history based on the volcano number (e.g. 357150 for the Puyehue-Cordón Caulle system and 211050 for La Fossa). Key features of the GVP database are preserved (e.g. VEI, confirmation and evidence; Siebert et al. 2010; Simkin and Siebert 1994) and the data can be plotted either as a histogram or as a cumulative distribution. Considering the entire Holocene catalogue, Fig. 3 a shows the frequency of eruptions per VEI class and Fig. 3 b shows the cumulative number of eruptions through time. The various segments characterized by distinctive slopes in Fig. 3 b illustrate the complications arising when unifying geological and historical records to compile a comprehensive eruptive history, discussed by Siebert et al. (2010). On one hand, the geological record is biased toward large eruptions and extends back in time. On the other hand, the historical record is detailed and preserves small and moderate eruptions but does not sufficiently extend back in time to capture eruptions of larger magnitudes. Figure 3 c illustrates the historical segment of the eruptive history of the Puyehue-Cordón Caulle system as inferred from the GVP database (i.e. break in slope at 1880 A.D. on Fig. 3 b). Note that breaks–in–slope associated with completeness might vary as a function of the VEI/magnitude class and should be assessed separately (Biass and Bonadonna 2013; Dzierma and Wehrmann 2010; Jenkins et al. 2012; Mendoza-Rosas and De la Cruz-Reyna 2008).

Eruptive history of Puyehue-Cordón Caulle volcanic system as recorded in the GVP database. a Screenshot of the GUI shows the number of eruptions per VEI class for all eruptions recorded in the GVP, where U stands for undefined and O for other. Alternative plots include, cumulative number of eruptions considering (b) all eruptions and (c) the most recent complete segment of the record, (d) and probability of eruption through time considering a Poisson model for all eruptions (black line, using the record shown in (c)), eruptions of VEI 2 (red line, completeness at 1880 A.D.), VEI 3 (green line, completeness at 1920 A.D.) and VEI 5 (orange line, completeness at 5000 B.C.)
If the eruptions are assumed to occur i) with a constant rate and ii) independently of the time since the last event, it is possible to obtain a first–order estimate of probability of occurrence of an eruption in a given time window by considering a Poisson process (e.g. Biass and Bonadonna 2013; Borradaile 2003). We aim at quantifying the probability that a repose interval T is smaller or equal to an arbitrary time window t:
which, in the simplest case of a Poisson process, results in an exponential distribution:
where t is a forecasting window (years) and λ is the eruption rate (number of eruptions per year) defined over a complete section of the eruptive catalog. As an example, the black line in Fig. 3 d shows the probability of eruption through time for a case where Fig. 3 c represents a complete historical record. In contrast, the colored lines plot probabilities for eruptions of VEI 2 (red line; completeness at around 1880 A.D.), VEI 3 (green line; completeness at around 1920 A.D.) and VEI 5 (orange line; completeness at around 5000 B.C.).
Note that the aim of TephraProb is scenario–based hazard assessments, i.e. based upon the conditional probability that the associated eruption scenario occurs; two caveats should be considered when using the GVP module. First, the GVP database is not a direct input to the probabilistic modelling in TephraProb and should be used as a support tool to develop eruption scenarios and identify critical ESPs with the full knowledge of the limitations and assumptions behind such databases (Biass and Bonadonna 2013; Dzierma and Wehrmann 2010; Jenkins et al. 2012; Mendoza-Rosas and De la Cruz-Reyna 2008; Siebert et al. 2010; Simkin and Siebert 1994). Second assessing the long–term probability of a future eruption is not trivial and should be achieved using a rigorous probabilistic framework in order to quantify and propagate various sources of uncertainties on final estimates (Bear-Crozier et al. 2016; Connor et al. 2003; Jenkins et al. 2012; Marzocchi and Bebbington 2012; Sandri et al. 2016; Sheldrake 2014; Thompson et al. 2015). Probabilities resulting from a Poisson process should not be viewed as more than a first–order estimate, and only when the hypotheses of stable rate and independent events are satisfied (Borradaile 2003).
Eruption scenarios
Based upon considerations described in Section “Eruptive history”, probabilistic strategies were introduced to account for biases associated with both small and large eruptions. On one hand, they help account for parts of the geological record that are not accessible or that have been removed. On the other hand, they allow for the consideration of larger eruptive events associated with lower probabilities of occurrence that have not taken place during the recent history but cannot be excluded. Probabilistic eruption scenarios rely on a large number of simulated events to explore the uncertainty associated with variable parameters. For tephra hazard, the two main variable parameters are magnitude/style and atmospheric conditions of a future eruption. The variability of a future eruption is commonly described by sets of critical ESPs defined as ranges and/or probability distributions, where the shape of a distribution reflects the degree of certainty for a particular scenario. The maximum degree of uncertainty for a given ESP will be typically described by a uniform distribution, whereas a logarithmic distribution favors the occurrence of smaller values compared to larger ones, and a Gaussian distribution preferentially samples around a central value. Similarly, some regions of the world experience seasonal wind trends, making a seasonal analysis of tephra hazard necessary. Identifying the degree of variability allowed during stochastic sampling requires subjective choices that are influenced by both the degree of knowledge of a volcanic system and the purpose of the hazard assessment.
Total grain–size distribution
Plume height, erupted mass and TGSD are the three most important ESPs for modeling tephra accumulation with Tephra2. In TephraProb, the sampling of plume heights and erupted masses are inherent to the probabilistic eruption scenarios described below, but the stochastic scheme for sampling TGSDs is similar for all scenarios and is therefore described first. TGSDs in TephraProb are assumed Gaussian (in ϕ units) and are defined by ranges of median diameters and sorting coefficients. It is then possible to modify the TGSD to account for aggregation using the empirical approach proposed by Bonadonna et al. (2002a) and Biass et al. (2014) based on observations from Cornell et al. (1983), Bonadonna et al. (2011), and Bonadonna et al. (2002b) by defining a range of values for the empirical aggregation parameter and a maximum diameter affected by aggregation processes.
The empirical aggregation parameter introduced in TephraProb follows Bonadonna et al. (2002a) and Cornell et al. (1983) and represents a weight fraction of particles that form aggregates. In our approach, a fraction of mass equal to the empirical aggregation parameter is removed from all bins equal to or finer than the maximum diameter (Biass et al. 2014; Bonadonna et al. 2002a). The total mass removed is then equally redistributed into bins ≤−1ϕ and >the maximum diameter (where > means coarser than). Although this aggregation scheme is a simple answer to a complex concept (e.g. Brown et al. 2012; Gilbert and Lane 1994; James et al. 2002, 2003; Rose and Durant 2011; Van Eaton et al. 2015) and is based uniquely on observations (Bonadonna et al. 2002b, 2011; Cornell et al. 1983), it is computationally efficient and suitable for hazard assessment purposes (Biass et al. 2014, 2016; Bonadonna et al. 2002a). This scheme has already been validated in previous studies with good agreement with field observations (e.g. Bonadonna et al. 2002a; Bonadonna and Phillips 2003; Cornell et al. 1983). Since no physics is involved in this method, it is not possible to draw a distinction between dry or wet aggregates. Instead, following the nomenclature proposed by Brown et al. (2012), using a maximum diameter of 5 ϕ suggests that particles <63 microns are influenced by aggregation processes (e.g. ash clusters, coated particles and poorly-structured pellets; Bonadonna et al. 2011), whereas a maximum diameter of 4 ϕ extends aggregation up to <125 microns (e.g. pellets with concentric structures (e.g. accretionary lapilli) and liquid pellets (i.e. mud rain); Gilbert and Lane 1994; Van Eaton et al. 2012, 2015).
At each probabilistic run, values of median diameters and sorting coefficients are sampled and used to create a Gaussian distribution. If wanted, the aggregation scheme is applied by randomly sampling an empirical aggregation parameter. The TGSD is then written as a text file and passed as an input to Tephra2.
General eruption scenarios
Probabilistic eruption scenarios implemented in TephraProb allow for the stochastic sampling of eruption source parameters and/or wind conditions, and various probability distributions are proposed for the sampling of ESPs (Table 1; Figs. 4 and 5). The two most general eruption scenarios implemented in TephraProb are (Bonadonna 2006):
-
Eruption Range Scenarios (ERS), designed to assess the probability of accumulation of a critical tephra accumulation based on the statistical distribution of possible eruption source parameters and wind conditions (i.e. stochastic sampling of one set of ESPs and one wind profile at each run);
Fig. 4 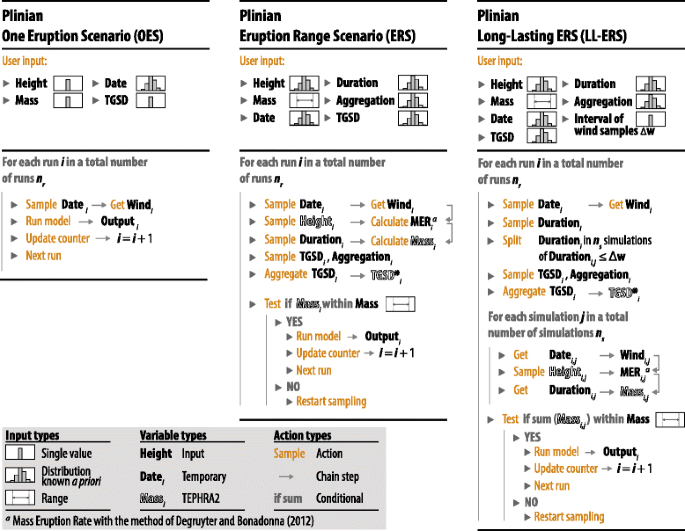
Workflows defined for the sub–Plinian and Plinian eruption scenarios implemented in TephraProb. Get refers to ESPs deterministically defined, Set defines a variable and Sample indicates a stochastic sampling. The index i refers to the run number, where the total number of runs is given by nr. For long–lasting eruptions, index j refers to the simulation number of run i, where the total number of simulations for run i is given by nw
Fig. 5 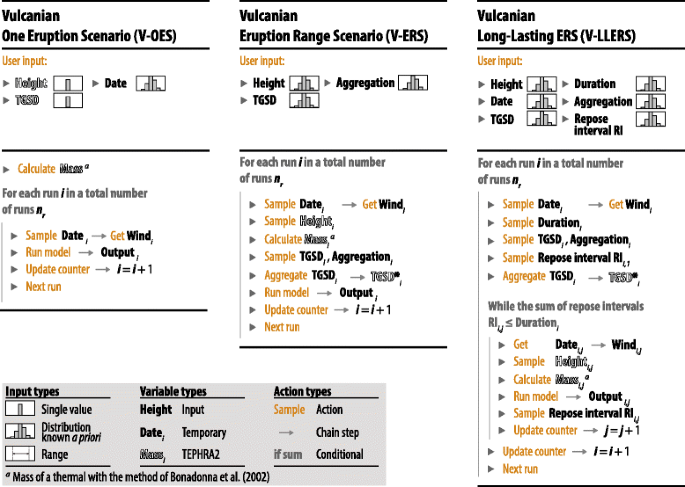
Workflows defined for the Vulcanian eruption scenarios implemented in TephraProb. The nomenclature follows Fig. 4
Table 1 Summary of probabilistic eruption scenarios implemented in TephraProb. All Plinian–type scenarios can be modeled as Long–lasting if the eruption duration is longer than the wind sampling interval -
One Eruption Scenarios (OES), designed to assess the probability of accumulation of a critical tephra accumulation based on the statistical distribution of wind conditions and a deterministically–defined eruption (i.e. stochastic sampling of one wind profile at each run while ESPs remain constant).


Derivations of these two scenarios are implemented in TephraProb in order to allow additional subjective choices to the stochastic sampling (Table 1):
-
Wind Range Scenarios (WRS) constrain the sampling of wind conditions within pre–defined radial sector around the volcano. Such scenarios are useful to assess the hazard at specific sites considering a specific wind scenario (e.g. Volentik et al. 2009). The probability of occurrence of the wind scenario can itself be assessed using the wind module of TephraProb;
-
Fixed Date Scenarios (FDS) fix the eruption starting date, thus assessing the probability of tephra accumulation based on the variability of eruption source parameters only. Rather than expressing the hazard of a future eruption, such scenarios are useful to assess the probability of a studied fallout event considering the statistical distribution of wind conditions (e.g. Elissondo et al. 2016). Outcomes of Fixed Date Scenarios can be compared to Eruption Range Scenarios and field–based isomass maps.
Eruptive styles
Different assumptions are made in TephraProb to calculate the erupted mass of sustained sub–Plinian and Plinian eruptions and nonsustained Vulcanian explosions, giving rise to Plinian–type and Vulcanian–type eruptions (Table 1; Figs. 4 and 5). Note that i) in our modelling scheme, sub–Plinian eruptive styles are hereafter considered as a part of Plinian–type eruptions and ii) both Plinian and Vulcanian–type styles can be modeled using the eruption scenarios described in Section“General eruption scenarios ”.
Plinian–type eruptions
Plinian–type eruption scenarios are defined by ranges and distribution shapes of plume height, eruption duration and eruption start date (Fig. 4). Additionally, the user also defines a range of erupted tephra mass. The sampling scheme, developed by Biass et al. (2014) and summarized in Fig. 4, is then applied. At each run, an eruption date, a plume height and an eruption duration are first sampled. The eruption date is used to retrieve the corresponding wind profile and combined with the plume height to calculate the MER following Degruyter and Bonadonna (2012):
where ρ a0 is the reference density of the surrounding atmosphere (kg m−3), g ′ the reduced gravity at the source (m s−2), α is the radial entrainment coefficient, \(\bar {N}\) is the average buoyancy frequency (s −1), H is the plume height (m above the vent), β is the wind entrainment coefficient and \(\bar {v}\) the average wind velocity across the plume height (m s−1). Note that Reanalysis datasets are only used to calculate \(\bar {v}\), and the calculation of other parameters (e.g. \(\bar {N}\), ρ a0) follows from Degruyter and Bonadonna (2012). The MER is used with the eruption duration to calculate the erupted tephra mass. If the resulting value falls within the user–defined mass range, then the run is sent to the model to be executed, or else the sampling process is re–started. Note that TephraProb also includes an option to sample plume heights and erupted tephra mass independently.
Vulcanian–type eruptions
In contrast, Vulcanian–type eruption scenarios are modeled as thermals (i.e. instantaneous release of mass) (Fig. 5). At each run, a plume height is sampled and used to calculate the mass of a thermal with the relationship (Bonadonna et al. 2002a; Druitt et al. 2002; Woods and Kienle 1994):
where Q=f×M×C×Δ T is the excess thermal mass of the thermal injection, f is the solid mass fraction capable of loosing heat to the plume, M (kg) is the plume mass, C (J kg −1 K −1) is the pyroclasts specific heat and Δ T (K) is the initial temperature contrast between the erupted mixture and the surrounding air. For Soufrière Hills volcano (Montserrat), f is taken as 0.8, C is 1100 J kg −1 K −1, Δ T is 800 K (Bonadonna et al. 2002a; Druitt et al. 2002), and the relationship between the Vulcanian plume height and the mass of the plume can be expressed as:
where H is the plume height (m asl), M is the plume mass (kg) and H V the vent height (m asl).
Long–lasting eruption scenarios
The hazard associated with long–lasting eruptions is complicated by the fact that wind conditions might vary during the course of an eruption. Long–lasting eruptions can be associated either with sustained plumes (e.g. 2010 eruption of Eyjafjallajökull, Iceland), or with repetitive emissions of limited to moderate amounts of ash (e.g. ongoing eruption of Soufrière Hills volcano, Montserrat, West Indies; ongoing eruption of Sakurajima volcano, Japan). In TephraProb these two eruptive styles are modelled as long-lasting Plinian and long-lasting Vulcanian eruptions, respectively (Figs. 4 and 5).
Long–lasting Plinian eruptions
Long–lasting Plinian scenarios are constrained by the temporal resolution Δ w of available wind data, which is 6 h for most Reanalysis datasets but can be varied within TephraProb. In cases where the eruption duration defined by the user is longer than the temporal resolution between wind profiles, the eruption is divided into Δ w–duration periods. The corresponding wind profile for each period is retrieved and the Eruption Range Scenario sampling scheme is performed, assuming that ESPs remain steady throughout the duration of the period (Fig. 4). If the sums of the masses of independent periods fall within the initial mass range, each period becomes a separate Tephra2 simulation, and the final accumulation of a long–lasting eruption is the sum of all periods.
Long–lasting Vulcanian eruptions
Long–lasting Vulcanian scenarios describe Vulcanian cycles and require the identification of the total duration of the cycle and the repose interval between explosions in order to apply the workflow shown in Fig. 5. At each run (i.e. each Vulcanian cycle), repose intervals and associated plume heights are constantly sampled until the sum of the repose intervals exceeds the eruption duration. The mass of each explosion is calculated with Eq. 6 and used in a separate Tephra2 simulation. The final accumulation of a Vulcanian cycle is the sum of all explosions. Note that TephraProb does not account for any relationship describing the influence of the repose interval on the corresponding plume height. More details on modeling Vulcanian cycles with TephraProb can be found in Biass et al. (2016).
Seasonality
Because some regions at low latitudes experience significant changes in wind patterns between dry and rainy seasons, a seasonality option is implemented in TephraProb to assess the variability in hazard as a function of the time of year. If the seasonality option is enabled, the user can define start and end dates of the rainy season and three scenarios will be run using winds for i) all months of the year, ii) months of the rainy season and iii) months of the dry season.
Post-processing
Post-processing functions in TephraProb process the individual outputs of a given eruption scenario into probabilities of exceeding given thresholds of tephra accumulations. Following Bonadonna (2006), we quantify the probability of hazardous thresholds of mass accumulations using:
where M(x,y) is the tephra mass accumulation (kg m−2) accumulated at given locations and M T a mass accumulation threshold. For a given eruption scenario, the probability P M at coordinates x,y is calculated based on the number of times a given threshold of accumulation is reached and divided by the total number of runs N R :
Outputs
Two scenarios for each volcano in Section “Case studies” were used as examples for TephraProb. First, the climatic phase (i.e. 4th of June) of the 2011 eruption of Cordón Caulle served as a case-study to model long–lasting sub-Plinian/Plinian eruptions. Eruption scenarios include a Long–Lasting Eruption Range Scenario (i.e. variable ESPs and wind conditions) and a Long–Lasting Fixed Date Scenario (i.e. variable ESPs and wind conditions set for the 4th of June 2011). ESPs for each scenario were defined from Bonadonna et al. (2015) and Pistolesi et al. (2015) and are summarized in Table 2. Second, La Fossa volcano was used to illustrate short–lasting sub–Plinian/Plinian eruptions and long–lasting Vulcanian cycles. The sub–Plinian eruptions were simulated using a One Eruption Scenario, whereas Vulcanian cylces were simulated using a Vulcanian Long–Lasting Eruption Scenario. Table 2 summarizes ESPs for both scenarios based on Mercalli and Silvestri (1891); Bianchi (2007) and Di Traglia et al. (2013).
Four variables need to be considered when displaying the probability of exceeding a given tephra accumulation, including geographic coordinates (Easting, Northing or longitude, latitude), a threshold of tephra accumulation and its associated exceedance probability. Since typical maps are limited by three dimensions, it is necessary to fix at least one degree of freedom. TephraProb can produce three main types of outputs.
Probability maps
Probability maps fix a threshold of tephra accumulation (kg m−2) to contour the associated spatial probability of exceedance, based upon the conditional probability that the given eruption scenario occurs (e.g. Fig 6). In Fig. 6, the minimum displayed probability is set to 0.1 and the red line contours the extent of the computational grid.

Hazard maps show the conditional probability of exceeding a threshold of tephra accumulation given the occurrence of the associated eruption scenario: a Long–lasting Eruption Range Scenario for Cordón Caulle volcano for a tephra accumulation of 10 kg m−2; b Long–lasting Fixed Date Scenario for Cordón Caulle for a tephra accumulation of 10 kg m−2; c One Eruption Scenario for a sub–Plinian eruption of La Fossa for a tephra accumulation of 10 kg m−2; d Vulcanian Long–Lasting Eruption Scenario for a Vulcanian eruption of La Fossa for a tephra accumulation of 100 kg m−2. ESPs for all scenarios are summarized in Table 2. The minimum displayed probability is 0.1 and the red line contours the extent of the calculation grid. The vent is indicated by a red triangle
Figure 6 a–b show probability maps compiled for an accumulation of 10 kg m−2 (i.e. critical threshold for crops) for the Long–Lasting Eruption Range Scenario and the Long–Lasting Fixed Date Scenarios of Cordón Caulle based on the climatic phase of the 2011 eruption (i.e. Unit 1 in Bonadonna et al. 2015; Pistolesi et al. 2015, Table 2). These maps show the importance of wind patterns in the hazard assessment of tephra fallout and, put in perspective of Fig. 2, show that the opening phase of the 2011 eruption (i.e. 4–5th of June) occurred in wind conditions of low probability but with high consequences for the town of San Carlos de Bariloche, which experienced accumulations of about 5 kg m−2 (Bonadonna et al. 2015; Pistolesi et al. 2015).
Figure 6 c–d show the probabilities of exceeding tephra accumulations of 10 and 100 kg m−2 following sub–Plinian OES (Fig. 6 c) and Vulcanian V–LLERS (Fig. 6 d) eruption scenarios at La Fossa volcano, respectively. Note that in the case of long–lasting Vulcanian scenarios, no syn–eruptive erosion between explosions is considered and Fig. 6 d should therefore be regarded as a probability map of the maximum accumulation.
Hazard curves
Hazard curves fix the geographical location to display the probability of exceeding any tephra accumulation at a given point (e.g. Bonadonna 2006). Figure 7 shows hazard curves for San Carlos de Bariloche using both Cordón Caulle scenarios described in Table 2. The dashed grey line on Fig. 7 corresponds to the accumulation of 5 kg m−2 reached in San Carlos de Bariloche during the 2011 eruption. Probabilistic analyses show that such an accumulation had an ∼2 % probability of occurrence considering the statistical distribution of wind directions of the past 10 years.

Hazard curves showing the conditional probability of exceeding any tephra accumulation given the occurrence of the associated eruption scenario at San Carlos de Bariloche. The dashed grey lines show an accumulation of 5 kg m −2 corresponding to the accumulation reached in San Carlos de Bariloche during the 2011 eruption of Cordón Caulle volcano
Probabilistic isomass maps
Probabilistic isomass maps fix a probability threshold to represent the typical tephra accumulation given a probability of occurrence of the hazardous phenomenon conditional on the occurrence of the associated eruption scenario (e.g. Biass and Bonadonna 2013; Biass et al. 2016). Figure 8 shows isomass contours (kg m−2) for a LLERS eruption of Cordón Caulle for probabilities of occurrence of 25 % (Fig. 8 a) and 75 % (Fig. 8 c). The choice of the probability threshold (which may be regarded as an acceptable level of hazard), is critical, and must be determined in collaboration with decision makers. The resultant probabilistic isomass maps should be presented in a style and format that meets the maps’ communication goals and decision makers’ needs. However, their use facilitates the incorporation of probabilistic approaches into pre–event impact assessments and are useful when communicating typical eruption scenarios to stakeholders.

Probabilistic isomass maps showing the typical tephra accumulations (kg m−2) for a conditional probability of occurrence of the hazard of 25 % (a) and 75 % (b) for a Long–lasting Eruption Range Scenario scenario at Cordón Caulle volcano
Discussion and conclusions
The TephraProb package aligns with recent efforts to bridge gaps between academic and operational contexts (Bartolini et al. 2013; Bear-Crozier et al. 2012; Felpeto et al. 2007). It provides a set of flexible tools for the assessment of tephra hazard and designed to compile comprehensive assessments in a wide range of conditions (e.g. poor constraints on scenarios, rapid assessments), that can be used in the context of probabilistic hazard assessments or separately (e.g. accessing and analyzing wind data or the GVP database). TephraProb integrates various levels of computational requirements and allows hazard assessments to be performed on single CPU computers (i.e. hazard curves only), multi–core personal computers (i.e. grids of moderate resolutions) and computer clusters (i.e. grids of fine resolutions). Resulting hazard assessments are conditional on the occurrence of the associated scenarios, and can serve as direct inputs to probabilistic frameworks such as Bayesian event trees to assess the long–term probability of tephra accumulation (Thompson et al. 2015) or to fit in multi–hazards assessments (Sandri et al. 2014). In order to facilitate the integration of further analyses, each output of TephraProb is saved in a variety of formats (e.g. ASCII columns format, ASCII ArcMap rasters).
The TephraProb package is currently tailored to generate Tephra2–friendly configuration files. However, probabilistic strategies implemented in the package are independent of the adopted model and could be modified to work with any VATDM. For instance, early versions of the macros implemented in TephraProb were applied by Biass et al. (2014) and Scaini et al. (2014) to assess the hazard and the related impact resulting from the eruption of critical Icelandic volcanoes on the European air traffic using the Eulerian model FALL3D (Costa et al. 2006; Folch et al. 2009). Similarly, these probabilistic approaches have already been successfully applied by Bonadonna et al. (2002a); Scollo et al. (2007); Jenkins et al. (2012) and Jenkins et al. (2014) based on both the HAZMAP and ASHFALL models (Armienti et al. 1988; Hurst and Turner 1999; Hurst 1994; Macedonio et al. 2005,1988).
The user manual of TephraProb, submitted as a supplementary file, provides in–depth technical descriptions of all the functions of the package. Each function is thoroughly commented in order to allow customization for more advanced users. In particular, functions to calculate the MER (Eq. 4; Degruyter and Bonadonna 2012) or to calculate the mass of a thermal (Eq. 6; Bonadonna et al. 2002a) contain guidance for modifying all empirical parameters. In addition, all users are free to modify the code for their own needs following the terms and conditions of the GNU GPL3 license.
Intentionally, no default scenario is provided in order to not promote TephraProb as a black box. When volcanoes with little documented history are considered, we encourage the user to rely on a global understanding of eruption processes combined with the use of global databases (Crosweller et al. 2012; Siebert et al. 2010; Simkin and Siebert 1994) to identify analogue eruptions. When eruption scenarios are based upon detailed field studies, the TError code (Biass et al. 2014) can serve as a systematic tool to identify the probability distributions of ESPs. In either case, the user manual of TephraProb provides a list of empirical parameters for Tephra2 for eruptions characterized by the inversion technique of Connor and Connor (2006).
This version of TephraProb is published on GitHub as a basis for further development based on inputs from the scientific community. Identified directios of development include i) the implementation of a variety of models available in the literature to quantify ESPs such as Sparks (1986); Wilson and Walker (1987); Mastin et al. (2009); Woodhouse et al. (2013) and Mastin (2014), ii) probabilistic inversion schemes to systematically assess the likelihood of past events (Elissondo et al. 2016) and iii) better integration of Reanalysis datasets to calculate the required atmospheric parameters (Degruyter and Bonadonna 2012).
References
Armienti, P, Macedonio G, Pareschi MT. A numerical model for simulation of tephra transport and deposition: Applications to May 18, 1980, Mount St. Helens eruption. J Geophys Res Solid Earth. 1988; 93(B6):6463–76. doi:10.1029/JB093iB06p06463.
Barberi, F, Ghigliotti M, Macedonio G, Orellana H, Pareschi MT, Rosi M. Volcanic hazard assessment of Guagua Pichincha (Ecuador) based on past behaviour and numerical models. J Volcanol Geothermal Res. 1992; 49(1–2):53–68. doi:10.1016/0377-0273(92)90004-W.
Bartolini, S, Cappello A, Martí J, Del Negro C. QVAST: a new Quantum GIS plugin for estimating volcanic susceptibility. Nat Hazards Earth Syst Sci. 2013; 13(11):3031–42.
Bear-Crozier, AN, Kartadinata N, Heriwaseso A, Nielsen O. Development of python-FALL3D: a modified procedure for modelling volcanic ash dispersal in the Asia-Pacific region. Nat Hazards. 2012; 64(1):821–38. doi:10.1007/s11069-012-0273-7.
Bear-Crozier, AN, Miller V, Newey V, Horspool N, Weber R. Probabilistic Volcanic Ash Hazard Analysis (PVAHA) I: development of the VAPAH tool for emulating multi-scale volcanic ash fall analysis. J Appl Volcanol. 2016; 5(1):1–20. doi:10.1186/s13617-016-0043-4.
Bianchi, L. L’eruzione 1888-1890 di Vulcano (Isole Eolie):Analisi stratigrafica, fisica e composizionale dei prodotti. Unpublished msc thesis, Università di Pisa. 2007.
Biass, S, Scaini C, Bonadonna C, Folch A, Smith K, Höskuldsson A. A multi-scale risk assessment for tephra fallout and airborne concentration from multiple Icelandic volcanoes - Part 1: Hazard assessment. Nat Hazards Earth Syst Sci. 2014; 14(8):2265–287. doi:10.5194/nhess-14-2265-2014.
Biass, S, Bonadonna C. A fast GIS-based risk assessment for tephra fallout: the example of Cotopaxi volcano, Ecuador-Part I: probabilistic hazard assessment. Nat Hazards. 2013; 65(1):477–95.
Biass, S, Bagheri G, Aeberhard W, Bonadonna C. TError: towards a better quantification of the uncertainty propagated during the characterization of tephra deposits. Stat Volcanol. 2014; 1(2):1–27. doi:10.5038/2163-338X.1.2.
Biass, S, Bonadonna C, Traglia F, Pistolesi M, Rosi M, Lestuzzi P. Probabilistic evaluation of the physical impact of future tephra fallout events for the Island of Vulcano, Italy. Bull Volcanol. 2016; 78(5):1–22. doi:10.1007/s00445-016-1028-1.
Birkmann, J. Measuring vulnerability to promote disaster-resilient societies: conceptual frameworks and definitions. In: Birkmann, J, editor. Measuring Vulnerability to Nat Hazards: Toward Disaster Resilient Societies. Tokyo: United Nations University Press: 2006. p. 9–54.
Blong, RJ. Volcanic Hazards. A Sourcebook on the Effects of Eruptions. Sydney: Academic Press; 1984, p. 424.
Bonadonna, C. Probabilistic modelling of tephra dispersion. In: Mader, HM, Coles SG, Connor CB, Connor LJ, editors. Stat Volcanol. London: Geological Society of London: 2006. p. 243–59.
Bonadonna, C, Macedonio G, Sparks R. Numerical modelling of tephra fallout associated with dome collapses and Vulcanian explosions: application to hazard assessment on Montserrat. In: Druitt, T, Kokelaar B, editors. The Eruption of Soufrière Hills Volcano, Montserrat, from 1995 To 1999 vol. 21. London: Geological Society: 2002a. p. 483–516.
Bonadonna, C, Mayberry G, Calder E, Sparks R, Choux C, Jackson P, Lejeune A, Loughlin S, Norton G, Rose WI, Ryan G, Young S. Tephra fallout in the eruption of Soufrière Hills Volcano, Montserrat In: Druitt, T, Kokelaar B, editors. The Eruption of Soufrière Hills Volcano, Montserrat, from 1995 To 1999. London: Geological Society: 2002b. p. 483–516.
Bonadonna, C, Connor CB, Houghton BF, Connor L, Byrne M, Laing A, Hincks TK. Probabilistic modeling of tephra dispersal: Hazard assessment of a multiphase rhyolitic eruption at Tarawera, New Zealand. J Geophys Res. 2005; 110(B3):B03203.
Bonadonna, C, Genco R, Gouhier M, Pistolesi M, Cioni R, Alfano F, Hoskuldsson A, Ripepe M. Tephra sedimentation during the 2010 Eyjafjallajökull eruption (Iceland) from deposit, radar, and satellite observations. J Geophys Res. 2011; 116(B12):12202.
Bonadonna, C, Phillips JC. Sedimentation from strong volcanic plumes. J Geophys Res Solid Earth. 2003; 108(B7):2340. doi:10.1029/2002JB002034.
Bonadonna, C, Folch A, Loughlin S, Puempel H. Future developments in modelling and monitoring of volcanic ash clouds: outcomes from the first IAVCEI-WMO workshop on Ash Dispersal Forecast and Civil Aviation. Bull Volcanol. 2012; 74(1):1–10.
Bonadonna, C, Cioni R, Pistolesi M, Elissondo M, Baumann V. Sedimentation of long-lasting wind-affected volcanic plumes: the example of the 2011 rhyolitic Cordón Caulle eruption, Chile. Bull Volcanol. 2015; 77(2):1–19. doi:10.1007/s00445-015-0900-8.
Borradaile, GJ. Statistics of Earth Science Data: Their Distribution in Time, Space, and Orientation. Berlin: Springer; 2003, p. 321.
Brown, R, Bonadonna C, Durant A. A review of volcanic ash aggregation. Phys Chem Earth Parts A/B/C. 2012; 45:65–78.
Collini, E, Osores MS, Folch A, Viramonte JG, Villarosa G, Salmuni G. Volcanic ash forecast during the June 2011 Cordón Caulle eruption. Nat Hazards. 2013; 66(2):389–412. doi:10.1007/s11069-012-0492-y.
Connor, C, Sparks R, Mason R, Bonadonna C, Young S. Exploring links between physical and probabilistic models of volcanic eruptions: The Soufrière Hills Volcano, Montserrat. Geophys Res Lett. 2003; 30(13):1701.
Connor, LJ, Connor CB. Inversion is the key to dispersion: understanding eruption dynamics by inverting tephra fallout. In: Mader, HM, Coles SG, Connor CB, Connor LJ, editors. Stat Volcanol. London: Geological Society of London: 2006. p. 231–42.
Cornell, W, Carey S, Sigurdsson H. Computer simulation of transport and deposition of the Campanian Y-5 ash. J Volcanol Geothermal Res. 1983; 17(1):89–109.
Costa, A, Macedonio G, Folch A. A three-dimensional Eulerian model for transport and deposition of volcanic ashes. Earth Planetary Sci Lett. 2006; 241(3–4):634–47.
Crosweller, HS, Arora B, Brown SK, Cottrell E, Deligne NI, Guerrero NO. Global database on large magnitude explosive volcanic eruptions (LaMEVE). J Appl Volcanol. 2012; 1(1):1–13. doi:10.1186/2191-5040-1-4.
De Fiore, O. Vulcano (Isole Eolie) In: Friedlaender, I, editor. Revisita Vulcanologica (Suppl. 3): 1922. p. 1–393.
Dee, DP, Uppala SM, Simmons AJ, Berrisford P, Poli P, Kobayashi S, Andrae U, Balmaseda MA, Balsamo G, Bauer P, Bechtold P, Beljaars ACM, van de Berg L, Bidlot J, Bormann N, Delsol C, Dragani R, Fuentes M, Geer AJ, Haimberger L, Healy SB, Hersbach H, Hólm EV, Isaksen L, Kållberg P, Köhler M, Matricardi M, McNally AP, Monge-Sanz BM, Morcrette JJ, Park BK, Peubey C, de Rosnay P, Tavolato C, Thépaut JN, Vitart F. The ERA-Interim reanalysis: configuration and performance of the data assimilation system. Q J R Meteorological Soc. 2011; 137(656):553–97. doi:10.1002/qj.828.
Degruyter, W, Bonadonna C. Improving on mass flow rate estimates of volcanic eruptions. Geophys Res Lett. 2012; 39:16. doi:10.1029/2012GL052566.
Di Traglia, F. The last 1000 years of eruptive activity at the Fossa Cone (Island of Vulcano, Southern Italy). PhD thesis, Università di Pisa. 2011.
Di Traglia, F, Pistolesi M, Rosi M, Bonadonna C, Fusillo R, Roverato M. Growth and erosion: The volcanic geology and morphological evolution of La Fossa (Island of Vulcano, Southern Italy) in the last 1000 years. Geomorphology. 2013; 194(0):94–107. doi:10.1016/j.geomorph.2013.04.018.
Druitt, TH, Young SR, Baptie B, Bonadonna C, Calder ES, Clarke AB, Cole PD, Harford CL, Herd RA, Luckett R, Ryan G, Voight B. Episodes of cyclic Vulcanian explosive activity with fountain collapse at Soufrière Hills Volcano, Montserrat. In: Druitt, T, Kokelaar B, editors. The Eruption of Soufrière Hills Volcano, Montserrat, from 1995 To 1999 vol 21. London: Geological Society: 2002. p. 281–306, doi:10.1144/GSL.MEM.2002.021.01.13.
Dzierma, Y, Wehrmann H. Eruption time series statistically examined: Probabilities of future eruptions at Villarrica and Llaima Volcanoes, Southern Volcanic Zone, Chile. J Volcanol Geothermal Res. 2010; 193(1–2):82–92.
Elissondo, M, Baumann V, Bonadonna C, Pistolesi M, Cioni R, Bertagnini A, Biass S, Herrero JC, Gonzalez R. Chronology and impact of the 2011 Cordón Caulle eruption, Chile. Nat Hazards Earth Syst Sci. 2016; 16(3):675–704. doi:10.5194/nhess-16-675-2016.
Felpeto, A, Marti J, Ortiz R. Automatic GIS-based system for volcanic hazard assessment. J Volcanol Geothermal Res. 2007; 166(2):106–16.
Folch, A, Costa A, Macedonio G. FALL3D: A computational model for transport and deposition of volcanic ash. Comput Geosci. 2009; 35(6):1334–42.
Gilbert, J, Lane S. The origin of accretionary lapilli. Bull Volcanol. 1994; 56:398–411.
Guffanti, M, Mayberry GC, Casadevall TJ, Wunderman R. Volcanic hazards to airports. Nat Hazards. 2009; 51(2):287–302.
Hurst, AW, Turner R. Performance of the program ASHFALL for forecasting ashfall during the 1995 and 1996 eruptions of Ruapehu volcano. N Z J Geol Geophys. 1999; 42(4):615–22. doi:10.1080/00288306.1999.9514865.
Hurst, A. ASHFALL–A Computer Program for Estimating Volcanic Ash Fallout. 1994. Technical Report 94/23, Institute of Geological & Nuclear Sciences, Wellington, New Zealand.
James, MR, Gilbert JS, Lane SJ. Experimental investigation of volcanic particle aggregation in the absence of a liquid phase. J Geophys Res Solid Earth. 2002; 107(B9). doi:10.1029/2001JB000950.
James, MR, Lane SJ, Gilbert JS. Density, construction, and drag coefficient of electrostatic volcanic ash aggregates. J Geophys Res Solid Earth. 2003; 108(B9). doi:10.1029/2002JB002011.
Jenkins, SF, Spence RJS, Fonseca JFBD, Solidum RU, Wilson TM. Volcanic risk assessment: Quantifying physical vulnerability in the built environment. J Volcanol Geothermal Res. 2014; 276:105–20. doi:10.1016/j.jvolgeores.2014.03.002.
Jenkins, S, Magill C, McAneney J, Blong R. Regional ash fall hazard I: a probabilistic assessment methodology. Bull Volcanol. 2012; 74(7):1699–712.
Kalnay, EC, Kanamitsu M, Kistler R, Collins W, Deaven D, Gandin L, Iredell M, Saha S, White G, Woollen J. The NCEP/NCAR 40-year reanalysis project. Bull Am Meteorological Soc. 1996; 77(3):437–71.
Kiyosugi, K, Connor C, Sparks RSJ, Crosweller HS, Brown SK, Siebert L, Wang T, Takarada S. How many explosive eruptions are missing from the geologic record? Analysis of the quaternary record of large magnitude explosive eruptions in Japan. J Appl Volcanol. 2015; 4(1):1–15. doi:10.1186/s13617-015-0035-9.
Lim, LL, Sweatman WL, McKibbin R, Connor CB. Tephra Fallout Models: The Effect of Different Source Shapes on Isomass Maps. Math Geosci. 2008; 40(2):147–57. doi:10.1007/s11004-007-9134-4.
Macedonio, G, Costa A, Longo A. A computer model for volcanic ash fallout and assessment of subsequent hazard. Comput Geosci. 2005; 31(7):837–45.
Macedonio, G, Pareschi MT, Santacroce R. A numerical simulation of the Plinian Fall Phase of 79 A.D. eruption of Vesuvius. J Geophys Res Solid Earth. 1988; 93(B12):14817–27. doi:10.1029/JB093iB12p14817.
Marzocchi, W, Sandri L, Gasparini P, Newhall C, Boschi E. Quantifying probabilities of volcanic events: the example of volcanic hazard at Mount Vesuvius. J Geophys Res. 2004; 109(B11201):1–18.
Marzocchi, W, Bebbington M. Probabilistic eruption forecasting at short and long time scales. Bull Volcanol. 2012; 74(8):1777–805.
Mastin, L, Guffanti M, Servranckx R, Webley P, Barsotti S, Dean K, Durant A, Ewert J, Neri A, Rose WI, Schneider D, Siebert L, Stunder B, Swanson G, Tupper A, Volentik A, Waythomas C. A multidisciplinary effort to assign realistic source parameters to models of volcanic ash-cloud transport and dispersion during eruptions. J Volcanol Geothermal Res. 2009; 186(1–2):10–21.
Mastin, LG. Testing the accuracy of a 1-D volcanic plume model in estimating mass eruption rate. J Geophys Res Atmospheres. 2014; 119(5):2474–495. doi:10.1002/2013JD020604.
Mendoza-Rosas, AT, De la Cruz-Reyna S. A statistical method linking geological and historical eruption time series for volcanic hazard estimations: Applications to active polygenetic volcanoes. J Volcanol Geothermal Res. 2008; 176(2):277–90.
Mercalli, G, Silvestri O. Le eruzioni dell’Isola di Vulcano incominciate il 3 agosto 1888 e terminate il 22 marzo 1890, relazione scientifica. Ann Ufficio Centrale Metereol Geodin Ital. 1891; 10:1–213.
Ogburn, S, Berger J, Calder E, Lopes D, Patra A, Pitman E, Rutarindwa R, Spiller E, Wolpert R. Pooling strength amongst limited datasets using hierarchical Bayesian analysis, with application to pyroclastic density current mobility metrics. Stat Volcanol. 2016; 2:1–26.
Pistolesi, M, Cioni R, Bonadonna C, Elissondo M, Baumann V, Bertagnini A, Chiari L, Gonzales R, Rosi M, Francalanci L. Complex dynamics of small-moderate volcanic events: the example of the 2011 rhyolitic Cordón Caulle eruption, Chile. Bull Volcanol. 2015; 77(1):1–24. doi:10.1007/s00445-014-0898-3.
Rose, W, Durant A. Fate of volcanic ash: Aggregation and fallout. Geology. 2011; 39(9):895–6.
Sandri, L, Thouret JC, Constantinescu R, Biass S, Tonini R. Long-term multi-hazard assessment for El Misti volcano (Peru). Bull Volcanol. 2014; 76(2):1–26. doi:10.1007/s00445-013-0771-9.
Sandri, L, Costa A, Selva J, Tonini R, Macedonio G, Folch A, Sulpizio R. Beyond eruptive scenarios: assessing tephra fallout hazard from Neapolitan volcanoes. Sci Rep. 2016; 6:24271.
Scaini, C, Biass S, Galderisi A, Bonadonna C, Folch A, Smith K, Höskuldsson A. A multi-scale risk assessment for tephra fallout and airborne concentration from multiple Icelandic volcanoes - Part 2: Vulnerability and impact. Nat Hazards Earth Syst Sci. 2014; 14(8):2289–312. doi:10.5194/nhess-14-2289-2014.
Scollo, S, Del Carlo P, Coltelli M. Tephra fallout of 2001 Etna flank eruption: Analysis of the deposit and plume dispersion. J Volcanol Geothermal Res. 2007; 160(1–2):147–64.doi:10.1016/j.jvolgeores.2006.09.007.
Scollo, S, Folch A, Costa A. A parametric and comparative study of different tephra fallout models. J Volcanol Geothermal Res. 2008a; 176(2):199–211. doi:10.1016/j.jvolgeores.2008.04.002.
Scollo, S, Tarantola S, Bonadonna C, Coltelli M, Saltelli A. Sensitivity analysis and uncertainty estimation for tephra dispersal models. J Geophys Res Solid Earth. 2008b; 113(B6):06202.
Sheldrake, T. Long-term forecasting of eruption hazards: A hierarchical approach to merge analogous eruptive histories. J Volcanol Geothermal Res. 2014; 286:15–23. doi:10.1016/j.jvolgeores.2014.08.021.
Siebert, L, Simkin T, Kimberly P. Volcanoes of the World. Berkley: University of California Press; 2010, p. 551.
Simkin, T, Siebert L. Volcanoes of the World. Tucson, AZ: Geoscience Press; 1994, p. 349.
Sparks, R. The dimensions and dynamics of volcanic eruption columns. Bull Volcanol. 1986; 48(1):3–15.
Suzuki, T. A theoretical model for dispersion of tephra. Arc Volcanism Phys Tectonics. 1983; 95:95–113.
Thompson, M, Lindsay J, Sandri L, Biass S, Bonadonna C, Jolly G, Marzocchi W. Exploring the influence of vent location and eruption style on tephra fall hazard from the Okataina Volcanic Centre, New Zealand. Bull Volcanol. 2015; 77(5):1–23. doi:10.1007/s00445-015-0926-y.
Van Eaton, AR, Mastin LG, Herzog M, Schwaiger HF, Schneider DJ, Wallace KL, Clarke AB. Hail formation triggers rapid ash aggregation in volcanic plumes. Nat Commun. 2015; 6:7860.
Van Eaton, A, Muirhead J, Wilson C, Cimarelli C. Growth of volcanic ash aggregates in the presence of liquid water and ice: an experimental approach. Bull Volcanol. 2012; 74(9):1963–1984.
Volentik, ACM, Connor CB, Connor LJ, Bonadonna C. In: Connor C, Chapman NA, Connor L, (eds).Aspects of volcanic hazards assessment for the Bataan nuclear power plant, Luzon Peninsula, Philippines. Cambridge: Cambridge University Press; 2009.
Volentik, ACM, Bonadonna C, Connor CB, Connor LJ, Rosi M. Modeling tephra dispersal in absence of wind: Insights from the climactic phase of the 2450BP Plinian eruption of Pululagua volcano (Ecuador). J Volcanol Geothermal Res. 2010; 193(1–2):117–36. doi:10.1016/j.jvolgeores.2010.03.011.
Volentik, AM, Houghton B. Tephra fallout hazards at Quito International Airport (Ecuador). Bull Volcanol. 2015; 77(6):1–14. doi:10.1007/s00445-015-0923-1.
Wilson, L, Walker G. Explosive volcanic eruptions - VI. Ejecta dispersal in plinian eruptions: the control of eruption conditions and atmospheric properties. Geophys J R Astr Soc. 1987; 89(2):657–79.
Wilson, T, Stewart C, Sword-Daniels V. Volcanic ash impacts on critical infrastructure. Phys Chem Earth Pt A/B/C. 2011; 45:5–23.
Woodhouse, MJ, Hogg AJ, Phillips JC, Sparks RSJ. Interaction between volcanic plumes and wind during the 2010 Eyjafjallajökull eruption, Iceland. J Geophys Res Solid Earth. 2013; 118(1):92–109. doi:10.1029/2012JB009592.
Woods, AW, Kienle J. The dynamics and thermodynamics of volcanic clouds: Theory and observations from the April 15 and April 21, 1990 eruptions of redoubt volcano, Alaska. J Volcanol Geothermal Res. 1994; 62(1–4):273–99. doi:10.1016/0377-0273(94)90037-X.
Acknowledgements
S. Biass and C. Bonadonna were supported by a SNF grant (#200021-129997). LJC and CBC were supported by a grant from the U.S. National Science Foundation (ACI 1339768). We thank editor J. Lindsay, reviewers A. van Eaton and A. Folch for helping improving this manuscript, S. Jenkins, L. Pioli and M. Rosi for comments on early versions of the manuscript, A. Parmigiani for his initial ideas, G. Wilson and M.-A. Thompson for testing early versions and all contributors to the Matlab File Exchange platform who kindly permitted the use of their functions within TephraProb. All computations were performed on the Baobab cluster of the University of Geneva. NCEP Reanalysis data provided by the NOAA/OAR/ESRL PSD, Boulder, Colorado, USA, from their Web site at http://www.esrl.noaa.gov/psd/.
Authors’ contributions
SB developed and wrote the TephraProb package and drafted the paper. Probabilistic techniques were developed by CB and CC and further developed by all authors. CB and CC designed the Tephra2 code, which was implemented and further developed by LC. All authors read and approved the final manuscript.
Competing interests
The authors declare that they have no competing interests.
Author information
Authors and Affiliations
Corresponding author
Rights and permissions
Open Access This article is distributed under the terms of the Creative Commons Attribution 4.0 International License(http://creativecommons.org/licenses/by/4.0/), which permits unrestricted use, distribution, and reproduction in any medium, provided you give appropriate credit to the original author(s) and the source, provide a link to the Creative Commons license, and indicate if changes were made.
About this article

Cite this article
Biass, S., Bonadonna, C., Connor, L. et al. TephraProb: a Matlab package for probabilistic hazard assessments of tephra fallout. J Appl. Volcanol. 5, 10 (2016). https://doi.org/10.1186/s13617-016-0050-5
Received:
Accepted:
Published:
DOI: https://doi.org/10.1186/s13617-016-0050-5